

In 2025 the Behavior Analyst Certification Board (BACB) printed results for 190 US program listings at 161 universities. The 20 largest listings, at 19 universities, trained 5,899 of the 8,090 first-time BCBA candidates in those listings: 72.9%, or about three in four (BACB 2025 report). The BACB’s own summary says it plainly: “Candidate volume is highly concentrated.” Here is what the public record shows about why, how many pass, and what any program can do with it.
- Five listings trained half of 2025’s US first-time candidates; the median listing had 11.
- Every one of the 20 largest is taught online (15 online only, 5 on campus and online), and none was among the listings the 2025 report marks as ABAI-accredited.
- Lower recorded tuition at the largest: weighted by candidates, the median top-20 listing records about $18,150 in tuition, against $26,750 at the 122 other listings with a recorded price.
- An estimated 48.7% of top-20 candidates passed the first time in 2025, against 56.4% in the other US listings; both groups’ estimated rates fell about 15 points from 2015.
- The data can’t show a regional gap by where students live. By where programs are based, rates differ, and the differences narrow when only on-campus and hybrid listings are compared.
01How concentrated is it?
Very. Arizona State University’s online program alone had 1,197 first-time candidates, 14.8% of the total. The five largest listings had 4,382 (54.2%), the ten largest 5,352 (66.2%) and the 50 largest 6,701 (82.8%). At the other end, 143 of the 190 listings had fewer than 20 candidates each, and the smaller half of all listings together had 743, about 9% of the total (BACB 2025 report).
Source: BACB, BCBA Examination Pass Rates for University Training Programs 2025, US listings (190 rows, 8,090 first-time candidates). Chart: Special Learning.
The numbers in this chart
| Largest listings | Candidates | Share of all |
|---|---|---|
| 1 | 1,197 | 14.8% |
| 5 | 4,382 | 54.2% |
| 10 | 5,352 | 66.2% |
| 20 | 5,899 | 72.9% |
| 50 | 6,701 | 82.8% |
| All 190 | 8,090 | 100% |
Notes on the count. The BACB states it lists a program only when it had more than six first-time candidates (its printed tables include a few six-candidate rows, which we count as printed), and its own footnote says the report covers 8,558 of the 9,955 first-time candidates tested worldwide in 2025 (86.0%), so the true field is larger and has more small programs than any list shows. And 23 small listings combine 2024 and 2025 candidates, as the BACB marks them; their numbers are counted as printed. The BACB prints 163 university names; we count 161, because National University absorbed Northcentral University and Cambridge College is now part of Bay Path University, and the report prints each pair under both names. Counted by university rather than by listing, the 20 largest universities trained 76.1%.
The concentration isn’t new. In the BACB’s 2015 figures the 20 largest US listings already held 75.3%. It was 64.4% in 2020 and 72.9% in 2025, comparing the listings reported each year (coverage and eligibility rules changed over time). Arizona State’s count went from 603 in 2020 to 1,197 in 2025. Meanwhile the field itself nearly tripled, from 3,323 first-time candidates in 2015 (BACB 2015-2019 report) to 9,955 in 2025.
02What the 20 largest have in common
Read the 20 listings side by side and four traits stand out. Each is a fact from the BACB’s report or the program’s own page; none, on its own, proves why students chose it.
- They are taught online. All 20 offer the program online: 15 online only and 5 both on campus and online. Across all listings, online programs had 76.5% of 2025 candidates (BACB 2025 report).
- Many serve people who already hold a master’s. 10 of the 20 offer a coursework-only certificate or sequence, alone or beside a degree, against 68 of the other 170, per each program’s page as recorded in our Program Finder. Florida Tech’s online certificate, the fourth largest listing, is 21 credits (Florida Tech).
- They publish lower tuition, on the whole. Weighted by candidates, the median tuition recorded for the 20 largest listings is $18,150 (Arizona State, $605 a credit for 30 credits, per ASU’s tuition schedule); across the 122 other listings with a recorded price, it is $26,750. Tuition here is before fees, at the resident rate for public universities, as the Program Finder records it from each school’s page. The comparison mixes certificates and degrees, so it doesn’t show what explains the difference.
- None was ABAI-accredited in the 2025 report. Of all US listings, the report marks 25 as accredited by the Association for Behavior Analysis International (ABAI); none of the 20 largest was among them, though five of their universities hold an accredited master’s elsewhere in their catalog (ABAI accredited programs).
| Program (as the BACB lists it) | Format | 2025 first-time candidates | 2025 pass rate | Rankings quartile, 2023-2025 | Tuition, before fees |
|---|---|---|---|---|---|
| Arizona State University Special Education - Applied Behavior Analysis | Online | 1,197 | 44% | Fourth | $18,150 |
| Ball State University Applied Behavior Analysis | Online | 1,026 | 50% | Third | $13,920 |
| Capella University Applied Behavior Analysis | Online | 928 | 41% | Fourth | $32,400 |
| Florida Institute of Technology Applied Behavior Analysis Certificate | Online | 807 | 69% | First | $11,760 |
| National University M.S. in ABA | On campus and online | 424 | 35% | Fourth | $20,880 |
| University of West Florida Center for Behavior Analysis | Online | 293 | 43% | Fourth | $15,048 |
| Purdue University Global M.S. Applied Behavior Analysis | Online | 285 | 46% | Fourth | $18,900 |
| Purdue University Global Graduate Certificate in ABA | Online | 168 | 43% | Fourth | $14,700 |
| University of Cincinnati Masters in Foundations in Behavior Analysis/Graduate Certificate in Behavior Analysis | Online | 146 | 38% | Third | $19,860 |
| Endicott College M.S. in Applied Behavior Analysis; Graduate Certificate in Applied Behavior Analysis Coursework | On campus and online | 78 | 59% | Second | $29,400 |
| University of North Texas M.A. in Applied Behavior Analysis | Online | 72 | 71% | First | $13,900 |
| Pepperdine University Applied Behavior Analysis | On campus and online | 70 | 47% | Third | $49,650 |
| George Mason University Graduate Certificate in Applied Behavior Analysis/ Master’s in Special Education with a Graduate Certificate in Applied Behavior Analysis | On campus and online | 60 | 45% | Third | $28,980 |
| Simmons University Behavior Analysis | Online | 53 | 79% | First | $46,080 |
| The Chicago School Post-master’s Certificate; M.S. in Applied Behavior Analysis | Online | 53 | 32% | Fourth | $57,342 |
| Manhattanville College Master of Professional Studies (M.P.S.) in ABA; Advanced Graduate Certificate in ABA | Online | 50 | 30% | Fourth | $40,330 |
| Western Connecticut State University Applied Behavior Analysis Program | Online | 50 | 72% | First | $14,400 |
| Russell Sage College Center for Applied Behavior Analysis | Online | 48 | 42% | Third | $26,030 |
| Bay Path University Applied Behavior Analysis | On campus and online | 47 | 79% | First | $35,280 |
| University of South Florida M.A. in Applied Behavior Analysis | Online | 44 | 86% | First | $25,200 |
Sources: candidates and pass rates from the BACB 2025 report; quartiles from our ABA Program Rankings (2023-2025, adjusted for size); tuition from each program’s own page, linked, as recorded in the Program Finder; where a school publishes a range, the lower end is shown, so check the linked page for your program and residency.
03The economics: why scale goes online
No public source records why each student picked a program, so what follows is evidence that fits the pattern, not proof of cause. Four forces line up with it.
Employer demand grew, and online programs reach across state lines. Job postings that required or preferred BCBA certification rose from 3,901 in 2015 to 132,307 in 2025, and the BACB/Lightcast report finds demand “has increased each year since 2010, with a 28% increase from 2024 to 2025” (BACB, US Employment Demand for Behavior Analysts: 2010–2025, pages 1-2). Postings aren’t filled jobs, but the direction is clear. The number of BCBAs grew from 19,795 in 2015 to 81,566 in 2025 (BACB certificant data, BCBA certificants per year). Demand is also somewhere other than where the large programs are based. The report puts California first, “accounting for 15% of the 2025 demand,” while programs based in California trained 605 of the 8,090 US candidates in the 2025 report (about 7%). An online program in Indiana, Arizona or Minnesota can serve a student in California or New Jersey.
Source: BACB, US Employment Demand for Behavior Analysts: 2010–2025 (Lightcast job-posting data, duplicates removed), page 2. Chart: Special Learning.
The numbers in this chart
| Year | Job postings |
|---|---|
| 2013 | 2,638 |
| 2014 | 2,903 |
| 2015 | 3,901 |
| 2016 | 6,203 |
| 2017 | 7,091 |
| 2018 | 16,109 |
| 2019 | 28,967 |
| 2020 | 33,996 |
| 2021 | 46,960 |
| 2022 | 57,569 |
| 2023 | 65,366 |
| 2024 | 103,150 |
| 2025 | 132,307 |
Graduate study moved online, and online markets reward scale. In fall 2024, 1,325,644 of 3,273,916 postbaccalaureate students in the US (40.5%) took only distance courses, and 653,688 of them studied at an institution in another state (NCES, Digest of Education Statistics, Table 311.15). Analysts of the online market tie concentration to “the impact of scale, brand, and early-mover advantage” (On EdTech, Market Concentration in US Online Learning, 2025). ABA training fits that picture, and goes further: the ten largest institutions hold 23.0% of all online graduate enrollment in that analysis, while the ten largest ABA listings held 66.2% of ABA candidates here (the two measures differ: all fields and institutions there, one field and its listings here). The early movers held on, too: Florida Tech was the largest listing every year from 2013 to 2017, and Arizona State, which has been the largest since 2022, grew from 123 first-time candidates in 2013 to 1,197 in 2025 (Program Finder history, from the BACB’s reports).
Online reach takes marketing, and partners often supply it. The US Government Accountability Office found at least 550 colleges working with an online program manager (OPM) as of July 2021, and reported a survey in which the services such companies most often provided were “marketing online programs (73 percent), market research (71 percent), and recruiting students (65 percent).” GAO also reports one college official’s view that “most online programs will enroll students within a radius of about 90 miles from the college” and that a college “cannot expect to be competitive outside its home state without the advertising reach and resources of an OPM” (GAO-22-104463, pages 11 and 14-15). We found no primary source on what any of the 20 largest ABA programs spends on marketing, so we don’t estimate it.
Programs built around a working adult’s week. Their own pages describe programs a working adult can start soon and fit around a job. National University lists “Monthly Start Dates” and “Year-round enrollment” for its online master’s (National University); Purdue Global’s brochure gives “Terms: 10 weeks” and “Start Dates: Throughout the year” (Purdue Global); Arizona State’s online master’s is 10 classes of 7.5 weeks each (ASU Online), and Ball State offers “7-week or 15-week” courses that students can start “any semester” (Ball State). Endicott, UNT and Florida Tech run on fall, spring and summer terms. Employer partnerships can lower tuition for eligible employees, though these pages don’t show how many enroll through them. Florida Tech’s Education Partner program gives qualified employees of enrolling companies “a discount of 10 percent on tuition rates” (Florida Tech); National University offers one ABA provider’s employees “a 15% tuition reduction scholarship” (National University); and Capella says “Tuition discounts and scholarships are available for eligible employees of our partner organizations” (Capella). One national ABA provider, Hopebridge, lists tuition partnerships with five of the ten largest (Hopebridge). Fieldwork points the same way: only 3 of the 20 largest listings build supervised fieldwork into the program, against 47 of the other 170; at 8 of the 20, students arrange their own, per each school’s pages in our Program Finder. These options can suit students who work while they study; whether fieldwork can happen at a student’s own workplace depends on the program and the site.
20 largest listingsAll other listings
Source: each program’s own pages, as recorded in our Program Finder (school pages read November 8-9, 2026), matched to the BACB 2025 report listings. Share of listings, not of candidates. Chart: Special Learning.
The numbers in this chart
| Fieldwork | 20 largest listings | All other listings |
|---|---|---|
| Some fieldwork built in | 3 of 20 | 47 of 170 |
| Program helps place | 6 of 20 | 40 of 170 |
| Student arranges | 8 of 20 | 34 of 170 |
| Not stated on its pages | 3 of 20 | 49 of 170 |
These programs offer online study on schedules built around a job, at a lower median recorded tuition, and in 2025 they trained 72.9% of first-time candidates in the US listings. The open question is what makes a program both large and strong.
04How many pass?
In 2025, 51% of all 9,955 first-time BCBA candidates passed, and the BACB notes that “2025 was the first year the BCBA examination was based on the BCBA Test Content Outline (6th ed.)” (BACB 2025 report, page 1). In 2015 the figure was 65% of 3,323 (BACB 2015-2019 report).
Among US listings, an estimated 48.7% of candidates from the 20 largest passed on the first try, against 56.4% from all others. Because they are so large, the 20 still produced about 70% of all estimated first-time passes: roughly 2,870 of 4,110. Most first-time passes in the US listings come from these 20.
Size doesn’t settle the result. Florida Tech’s online certificate had 807 candidates and a 69% pass rate; six of the 20 sit in the first quartile of our Rankings for 2023-2025, and eight in the fourth. And the gap isn’t the whole story of the decline: since 2015, the estimated rate fell about 15 points both for the 20 largest listings (64.1% to 48.7%) and for all others (71.8% to 56.4%).
20 largest listingsAll other listings
Source: same BACB reports as Figure 2. Rates are estimates: each listing’s candidates times its printed (rounded) pass rate, added up. The 20 largest are picked again each year, so the groups change. Chart: Special Learning.
The numbers in this chart
| Year | 20 largest | All others | All US listings |
|---|---|---|---|
| 2013 | 57.6% | 61.5% | 58.4% |
| 2014 | 58.1% | 62.4% | 59.1% |
| 2015 | 64.1% | 71.8% | 66.0% |
| 2016 | 64.6% | 71.8% | 66.4% |
| 2017 | 64.2% | 73.2% | 66.6% |
| 2018 | 62.4% | 68.2% | 64.1% |
| 2019 | 61.1% | 67.1% | 62.8% |
| 2020 | 62.5% | 70.6% | 65.4% |
| 2021 | 57.6% | 64.0% | 59.7% |
| 2022 | 53.2% | 66.3% | 57.5% |
| 2023 | 56.3% | 60.6% | 57.7% |
| 2024 | 52.7% | 57.8% | 54.2% |
| 2025 | 48.7% | 56.4% | 50.8% |
Format and accreditation line up with pass rates too. In 2025, an estimated 73.8% of candidates from on-campus listings passed, against 49.2% from online ones. Across its whole 2025 report, US and abroad, the BACB gives a mean program pass rate of 79.3% for the 25 ABAI-accredited programs and 53.2% for the 179 others; in the US listings, accredited programs trained 295 of the US candidates (3.6%). These groups also differ in size, and the data can’t separate admissions, students’ backgrounds, teaching and other program features.
Source: BACB 2025 report, format as the BACB lists it; rates estimated from printed rates. Over 2023-2025 the Rankings estimate the same pattern: 74.0% of 1,109 candidates from ranked on-campus programs passed, against 52.2% of 16,304 from ranked online ones.
The numbers in this chart
| Format | Listings | Candidates | Share of candidates | Est. pass rate |
|---|---|---|---|---|
| On campus | 44 | 489 | 6.0% | 73.8% |
| Hybrid | 25 | 291 | 3.6% | 55.7% |
| Online | 82 | 6,185 | 76.5% | 49.2% |
| On campus and online | 39 | 1,125 | 13.9% | 48.0% |
05Is there a regional gap?
The BACB reports results by program, not by where a candidate lives, so these data can’t show whether students from one part of the country pass more often than others. What can be estimated is a pass rate grouped by each program’s home state. The Midwest and West include the three largest online programs (Ball State in Indiana, Capella in Minnesota and Arizona State), and their regional rates are the lowest (47.1% and 44.7%). Counting only on-campus and hybrid listings, every region lands between 62.3% and 71.8%, on small numbers (780 candidates in all). Regions follow the US Census Bureau’s four regions.
All listings based in the regionOn-campus and hybrid listings only
Source: BACB 2025 report; program state as matched to the federal IPEDS directory; regions as the US Census Bureau defines them. Numbers under each region: candidates in all listings / in on-campus and hybrid listings.
The numbers in this chart
| Region | Listings | Candidates | Est. pass rate | On-campus and hybrid listings | Their candidates | Their est. pass rate |
|---|---|---|---|---|---|---|
| Northeast | 60 | 1,087 | 53.6% | 22 | 292 | 62.3% |
| Midwest | 48 | 3,073 | 47.1% | 17 | 143 | 65.7% |
| South | 58 | 1,959 | 61.1% | 21 | 246 | 71.6% |
| West | 24 | 1,971 | 44.7% | 9 | 99 | 71.8% |
06The 2032 change
The BACB’s 2025 report says: “Beginning January 1, 2032, all applicants for BCBA certification must have already completed a master’s degree or higher from ABAI- or APBA-accredited programs to qualify.” It tells prospective students to “verify degree accreditation status before enrolling” (BACB 2025 report, page 2). The BACB’s faculty page adds: “Only ABAI or APBA-accredited program degrees will qualify for certification since pathway 2 will be discontinued.” It also notes: “ABAI’s Tier 2a- and 2b-recognized programs will no longer be accepted.” (Source: BACB, University training for those pursuing BCBA certification). APBA, which “began accepting applications for review on January 20, 2026,” accredits master’s programs only: “Stand-alone graduate certificate programs are not included” (APBA accreditation FAQs). That matters most where most candidates train: none of the 20 largest listings was marked accredited in 2025, and 10 of them offer a coursework-only route.
For the 2032 plan, check each program’s current accreditation status and its stated plans directly with ABAI and APBA. Recognition under ABAI’s tiered model (Tier 2a or 2b) will no longer be enough.
07What a program or instructor can do
Our view: students should be able to find the programs whose candidates do best, and a program in a lower quartile is a program with room to grow, not a judgment of its people. A quartile is where questions start. We can help with that, and here is where that help starts, using the public record:
- Read your own three years, with their range. Find your program in the ABA Program Rankings: each rate comes with a 90% range, and 58 of 129 ranked programs can’t yet be told apart from the estimated 54.1% pooled rate for all candidates in 2023-2025. Compare yourself with programs of your format and size, not with the national figure.
- Check your courses against the 6th edition outline. 2025 was its first exam year. Map each course to the BCBA Test Content Outline (6th ed.) and ask your last cohort which areas felt thinnest.
- Put cost, start dates and fieldwork on one public page. The BACB tells students to weigh “program cost and format, faculty and student supports, fieldwork opportunities” beside pass rates (BACB 2025 report). Our Program Finder couldn’t find a fieldwork arrangement stated on the school’s pages for 75 of the 234 programs it lists; saying it plainly helps the students you want find you.
- Start the 2032 plan now. If your students take a coursework-only sequence or an unaccredited degree, read ABAI’s accreditation list and APBA’s accredited programs page and set a date for your decision.
- Correct the record. If a number about your program is wrong, every row in the Rankings and Finder has a correction link.
Free slides for your class
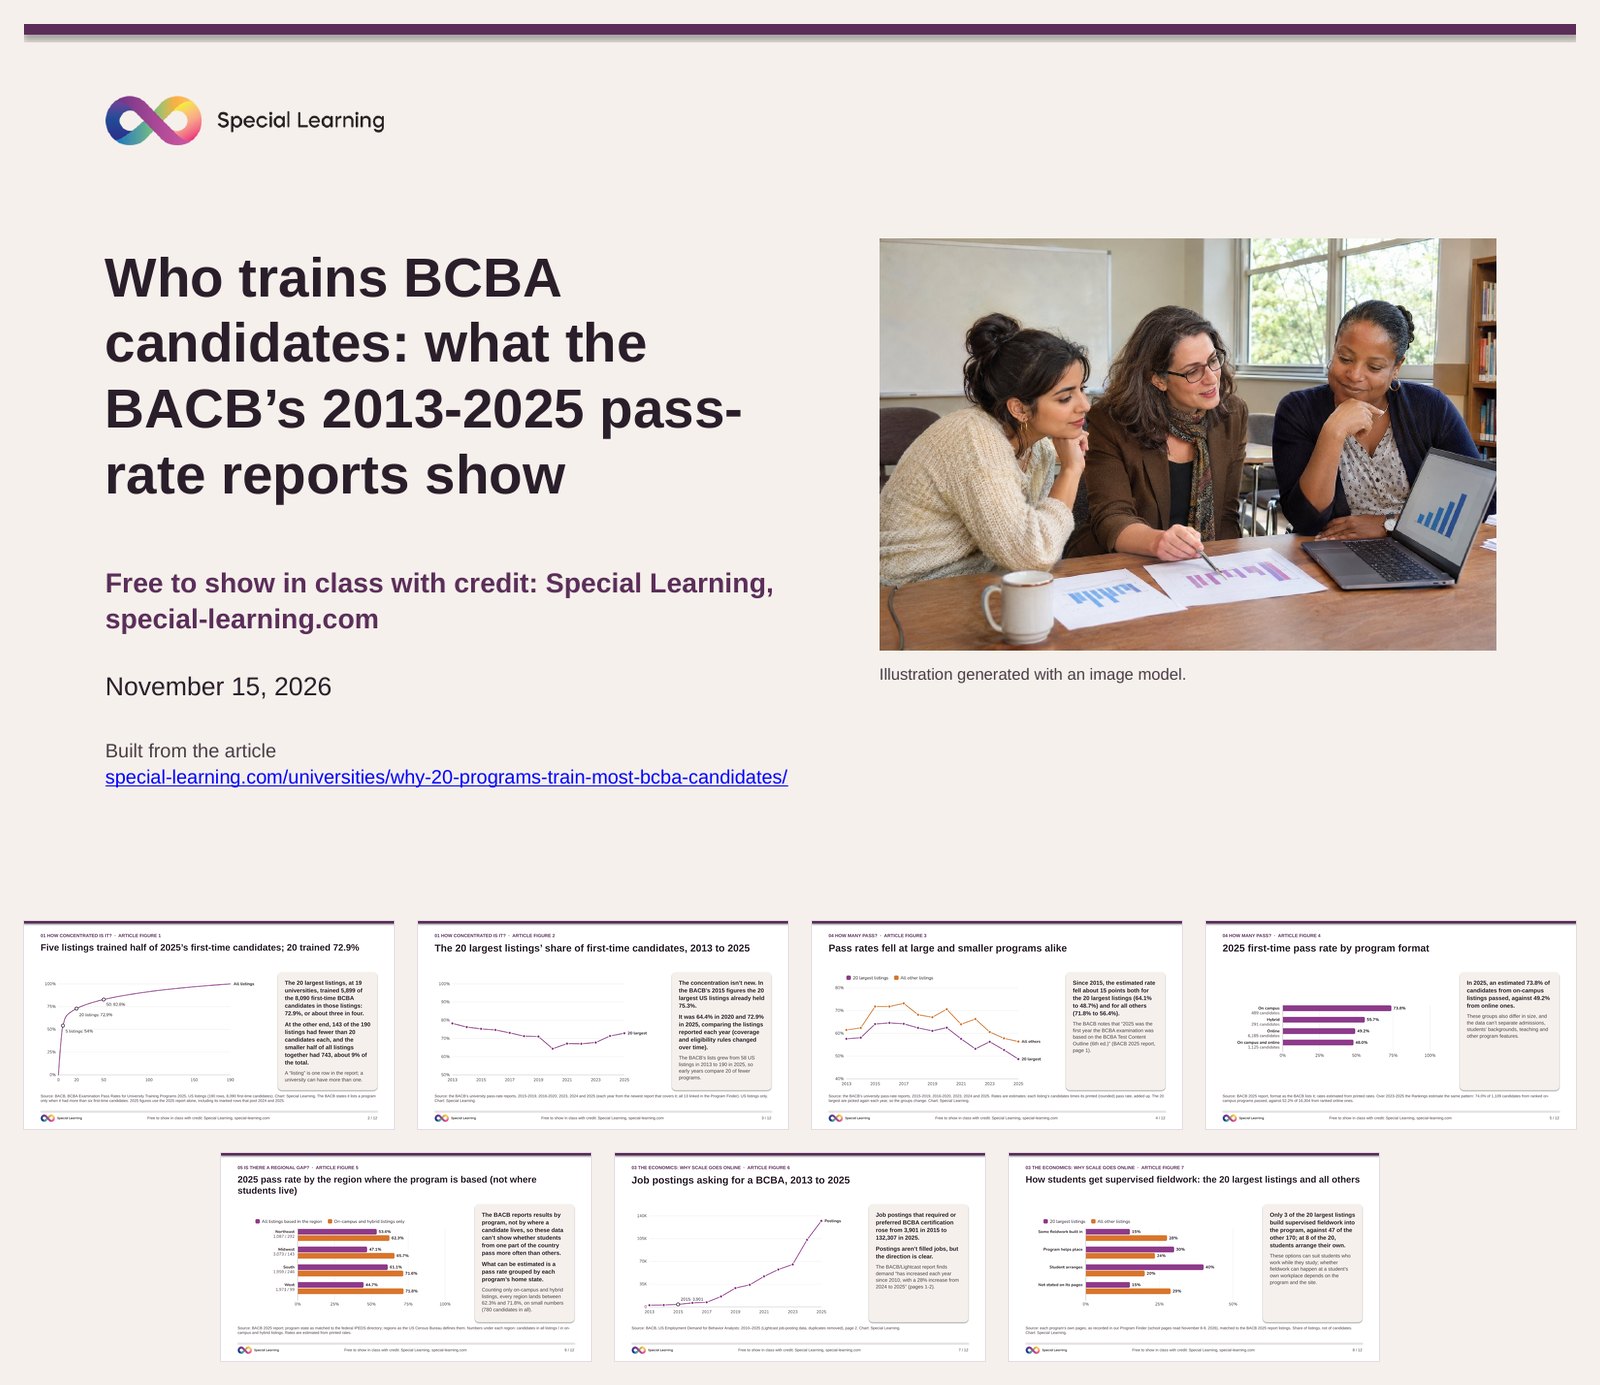
Twelve slides built from our analysis of the BACB’s 2013-2025 pass-rate reports: its seven charts with their sources, the BACB’s 2032 change in its own words, four discussion questions and full citations, free to show in class with credit to Special Learning.
Your next step: the SL Global ABA Instructor Network
If you teach ABA, special education or a course where ABA comes up, join our instructor network. It’s free: you get the Special Learning catalog on your own account, material you may show in class with credit, and a code to share with your students. Each term we ask three questions about where your students get stuck; each answer goes to the person who builds our courses, and you hear back when the fix ships.
Or start with the free tools: the ABA Program Rankings and the BCBA Program Finder.
How we counted
Program counts, candidates and pass rates are the BACB’s, as printed in its university pass-rate reports, US listings only, read row by row and checked against each report’s own totals. A “listing” is one row in the report; a university can have more than one. Pass rates for groups are estimates: each listing’s candidates times its printed, rounded rate, added up. 2025 figures use the 2025 report alone, including its marked rows that pool 2024 and 2025. The Rankings combine the 2023 to 2025 reports, and eight ranked programs include 2023 rows that the BACB pooled with 2022. Program state comes from the federal IPEDS directory. Tuition and fieldwork come from each program’s own pages as recorded in the Program Finder (school pages read November 8-9, 2026; the Finder’s data copied November 15, 2026). Pass rates describe candidates, not what causes a difference; the BACB’s words are that they “are not rankings, endorsements, or guarantees of future or individual performance.”
Next step: if you teach ABA, join the SL Global ABA Instructor Network: free access to the Special Learning catalog for you, and material to use in class.
See something wrong? Write to contact@special-learning.com and we will check it against the source and correct it.
Karen Chung is the Founder and CEO of Special Learning. Special Learning exists to move the more than one billion people touched by autism, worldwide, toward independence; families, caregivers and educators are the front door, and the professionals who serve them are the delivery arm.