
For special education teachers and paraprofessionals
Special Education Data Collection: free sheets, and how classroom staff use them
Every IEP has to say how a student’s progress toward each annual goal will be measured, and when the family will get progress reports (34 CFR 300.320(a)(3)). In a classroom that comes down to four habits: pick one data type that fits the goal, collect it at a time one adult can keep, graph it, and use a simple rule to decide whether to keep teaching the same way. Below are the nine data types with what goes on each sheet, a sample task analysis sheet, a decision rule from the IRIS Center, and free tools from IRIS, the National Center on Intensive Intervention (NCII), AFIRM and us.
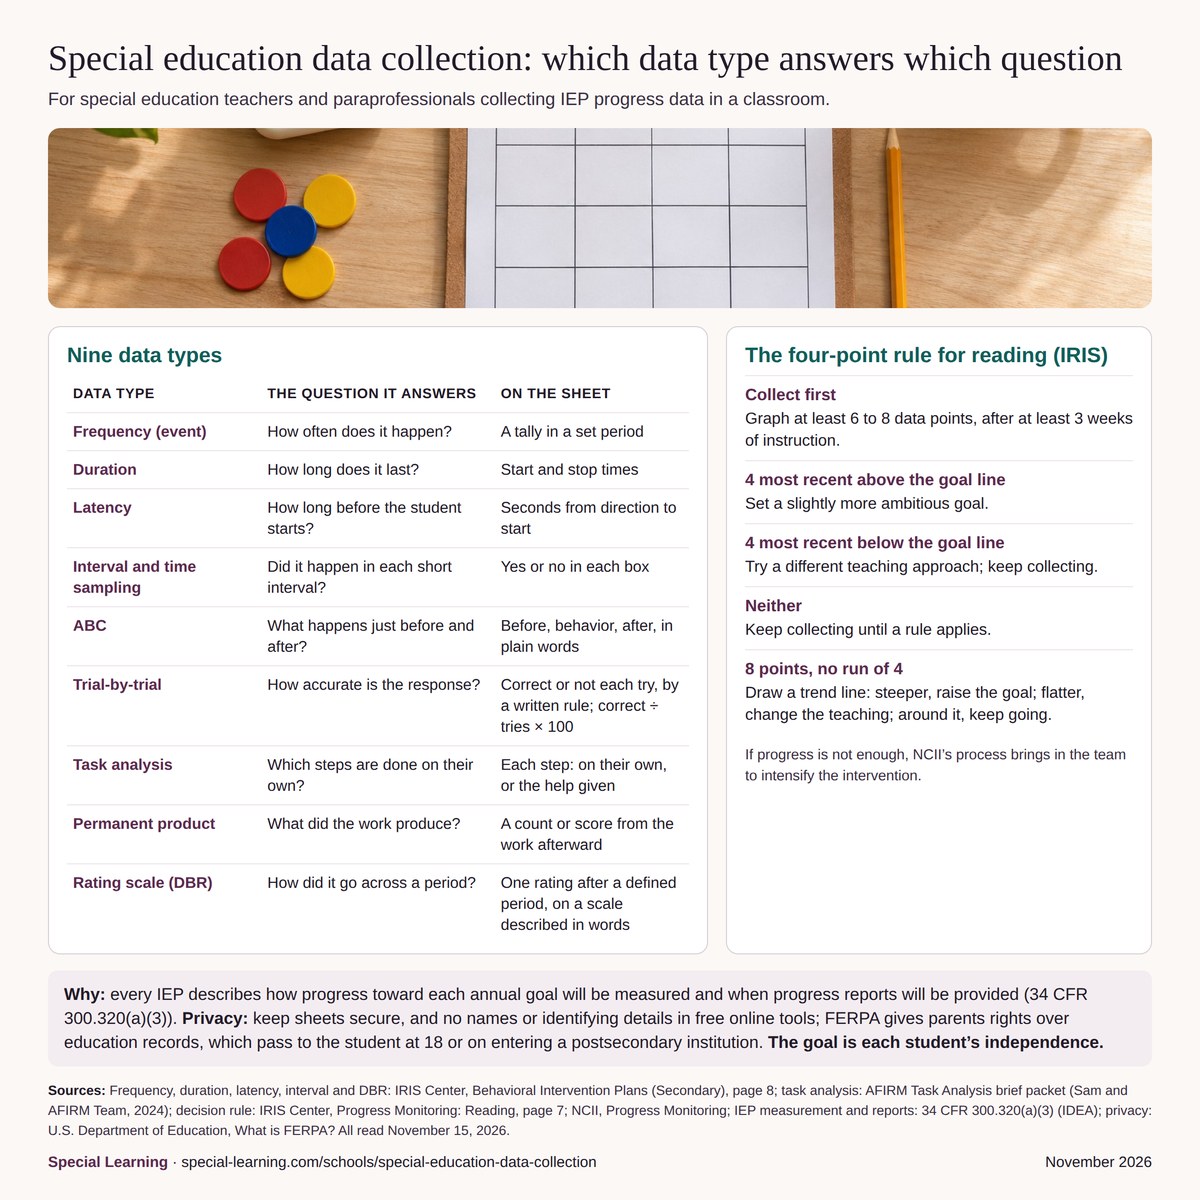
See the nine data types
What the IEP requires
01Why collect data
The law asks for it. An IEP must include “A statement of measurable annual goals” and a description of “How the child’s progress toward meeting the annual goals … will be measured” and “When periodic reports on the progress the child is making toward meeting the annual goals (such as through the use of quarterly or other periodic reports, concurrent with the issuance of report cards) will be provided” (34 CFR 300.320(a)(2) and (a)(3)). The data you collect each week is what those reports are written from.
The student gains most. Repeated data helps the team judge whether the teaching is supporting progress and when to adjust it; how long that takes depends on the goal, the measurement schedule and the pattern in the data. It also shows a student their own progress: the IRIS Center suggests that “Whenever possible, data should be shared with the student,” and that educators might teach students “to graph their own data to help them see their progress over time” (IRIS, Behavioral Intervention Plans, page 8).
Start with the definition. To keep data consistent from one adult to the next, IRIS says a behavior must be defined in terms that are observable (“what the behavior looks and sounds like”), measurable (defined “in such a way that it can be counted or timed”) and actively stated (“what the student does rather than what they fail to do”). “Raises a hand and waits to be called on” can be counted; “is respectful” can’t.
Read on IRIS, AFIRM and NCII, November 15, 2026
02The nine data types a classroom uses
IRIS lists the classroom’s main direct-observation methods: “Frequency or event recording—documenting the number of times a behavior occurs within a given period of time,” interval recording, duration recording and latency recording, and adds Direct Behavior Rating, “a method of data collection in which an educator regularly rates a student’s behavior on a continuum” (IRIS). Skill goals add trial-by-trial data, task analysis and permanent products. Each row below doubles as a sheet: the third column is what goes on it.
| Data type | The question it answers | What staff write on the sheet | Fits goals like |
|---|---|---|---|
| Frequency (event) | How often does it happen? | A tally each time it happens, in a set period (for example, 9:00 to 9:30). If the periods differ in length, divide by the minutes to get a rate. | Hand-raising, requests for help, greetings |
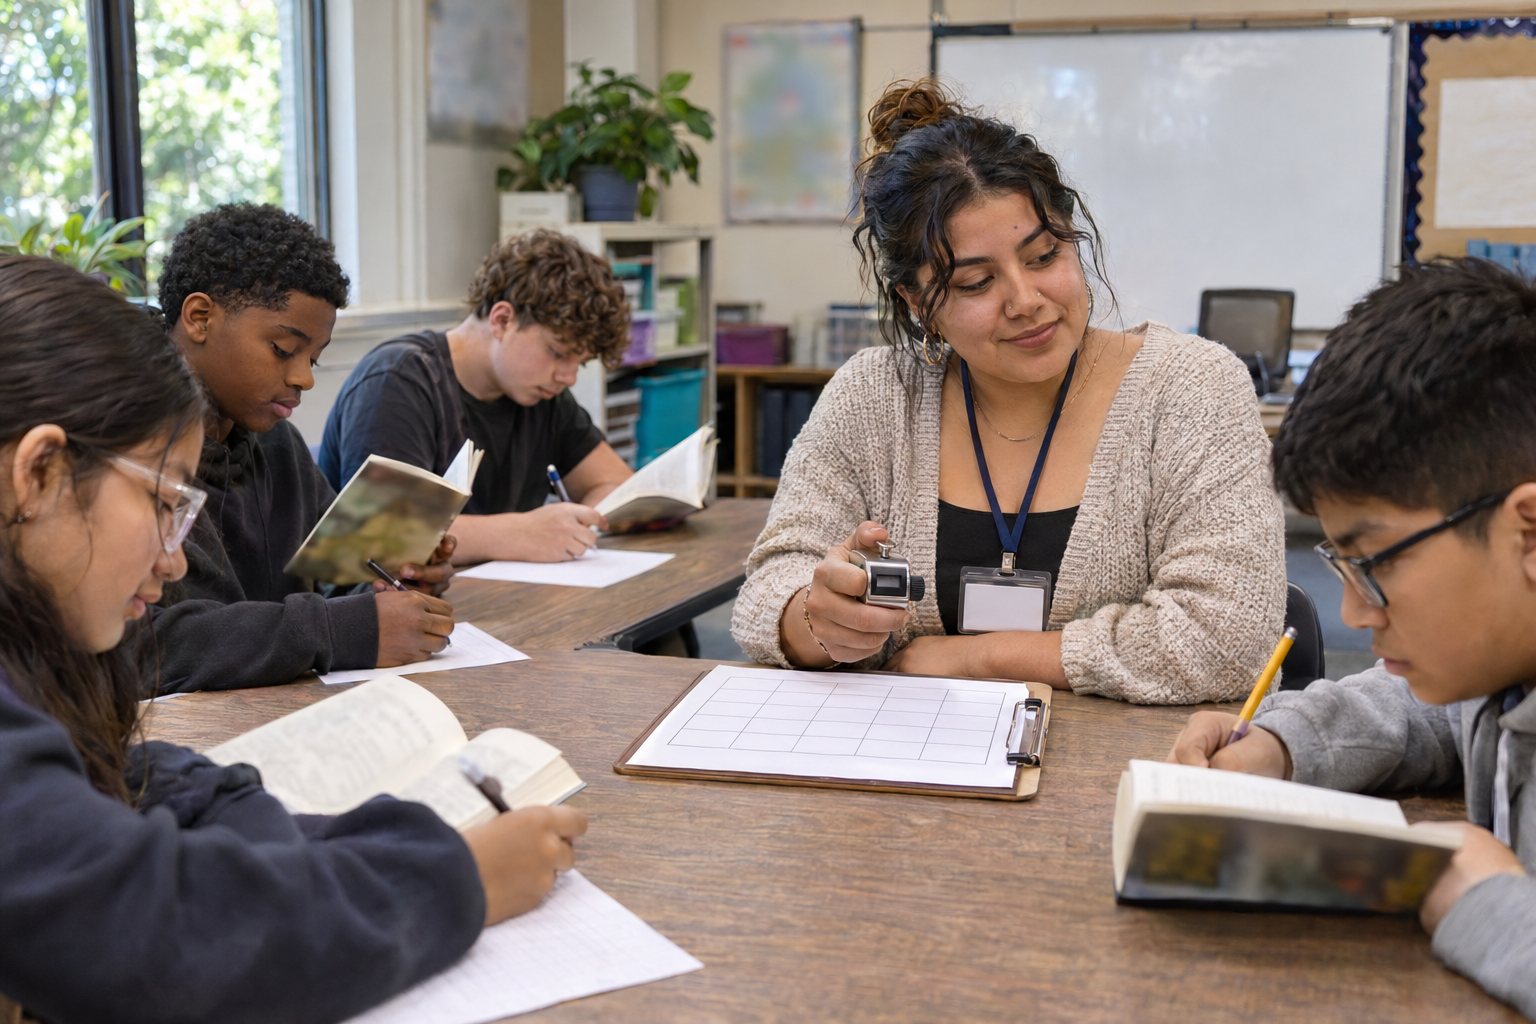
| Duration | How long does it last? | Start and stop times for each occurrence, or the total minutes. | Minutes on task during independent work, minutes to finish a routine |
| Latency | How long before the student starts? | Seconds from the direction or prompt to the start of the response. | Starting work after “take out your journal” |
| Interval and time sampling | Did it happen during each short interval? | A grid of short intervals (for example, 10 one-minute boxes), each marked yes or no. Whole-interval: all of the interval; partial-interval: any of it; momentary time sampling: at the moment the interval ends. | Engagement, behaviors that happen often or have no clear start and end |
| ABC (antecedent, behavior, consequence) | What happens just before and just after? | Time, what happened right before, what the student did, and what happened right after, in plain observable words. | Planning support for a behavior with the team |
| Trial-by-trial and percentage correct | How accurate is the response? | Correct or incorrect for each opportunity, by a written scoring rule, with any prompt noted; say whether the goal counts independent or supported responses. Percentage = correct ÷ opportunities × 100 (7 correct of 10 = 70%). | Naming sight words, matching, answering questions |
| Task analysis | Which steps of a routine are done on their own? | The routine’s steps down the side; for each step, done on their own or the help that was given. | Hand washing, packing up, a job routine |
| Permanent product | What did the work produce? | A count or score taken afterward from the work itself, so nobody has to watch in the moment. | Sentences written, problems completed, items assembled |
| Rating scale (Direct Behavior Rating) | How did it go across a period, on a scale? | One rating right after a defined observation period, on a scale whose points are described in words (for example, 0 to 10), from an adult who was there. | Engagement or following directions across a class period |
Every sheet, whatever its type, needs the same header: the date, a student code, the goal in the IEP’s words, the written definition, the time or activity, and the initials of the adult recording.
Step by step
03Task analysis, with a sample sheet
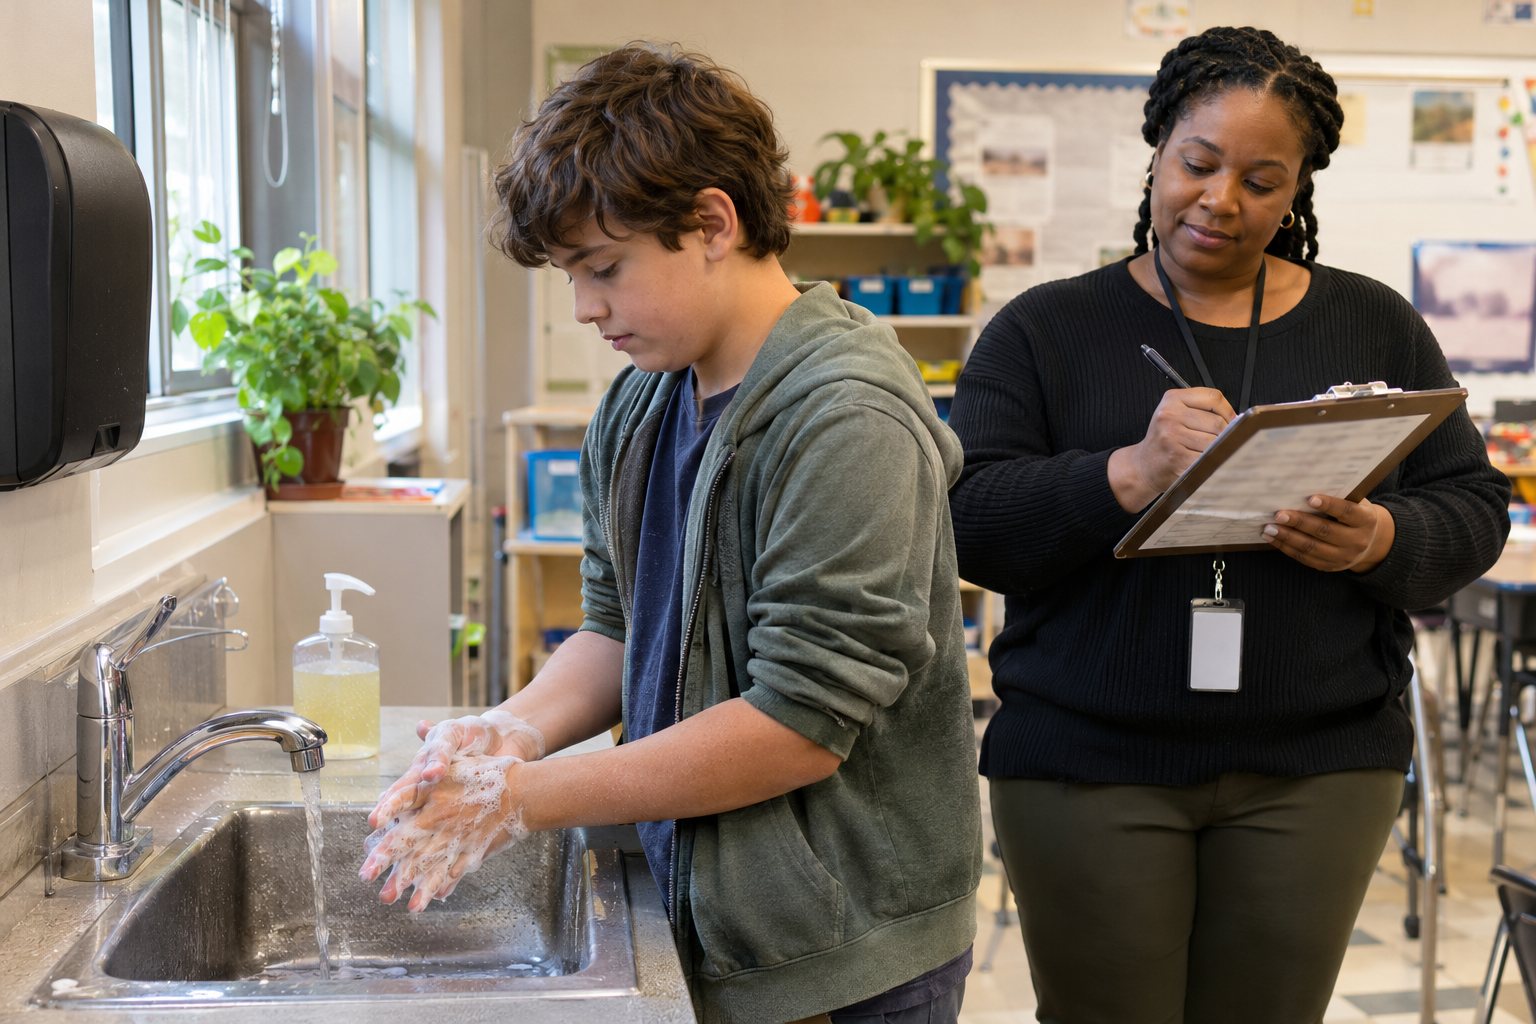
Task analysis breaks a routine into small steps. In AFIRM’s words, it “can be used to break down complex skills or behaviors into smaller, discrete steps,” and as the learner masters each step, “the learner will gradually become more independent using the target skill or behavior” (AFIRM Task Analysis brief packet, 2024). It meets the evidence-based practice criteria of the National Clearinghouse on Autism Evidence and Practice’s 2020 review, with 13 single case design studies with autistic learners from preschool through age 22; AFIRM names teachers, special educators and paraprofessionals among the people who use it.
AFIRM describes three ways to teach the steps:
- Forward chaining: “The first step in a chain is taught first. As each step is mastered, the next step is taught.”
- Backward chaining: “The final step in a chain is taught first. As each step is mastered, the previous step is taught.” An adult helps with the earlier steps, so the student finishes the routine every time.
- Total task presentation: the learner “performs entire chain with reinforcement at each step.”
Whichever you choose, the sheet looks the same. Write the steps the way the student does them, and observe the routine on several days before teaching to see where to start. Agree in advance how help will be given, then mark every step each time you collect, including steps an adult completed or the student did not attempt:
| Step | Mon | Wed | Fri |
|---|---|---|---|
| 1. Turn on the water | + | + | + |
| 2. Wet hands | + | + | + |
| 3. Get soap | V | + | + |
| 4. Rub all hand surfaces with soap | M | V | + |
| 5. Rinse hands | + | + | + |
| 6. Turn off the water | V | V | + |
| 7. Dry hands with a paper towel | P | M | V |
| 8. Throw the towel away | V | + | + |
| Steps done on their own | 3 of 8 (38%) | 5 of 8 (63%) | 7 of 8 (88%) |
Key: + done correctly on their own; V done with a verbal prompt; M done after a model; P done with physical help; A adult did the step; N not attempted. Percentages are + marks ÷ 8 × 100, rounded. Use the agreed prompting procedure and record the help actually given for each step; mark + only when the student completes the step correctly without a prompt.
The number to graph is the share of steps done on their own. Across these three observations, steps done on their own rose from 3 of 8 to 7 of 8; drying hands still needed a verbal prompt on Friday. Keep collecting, and plan the next teaching from repeated observations and the chaining method you chose, toward the student’s independence. AFIRM’s free Task Analysis module and its brief packet, with a step-by-step guide, implementation checklists for each kind of chaining and a monitoring progress checklist, are the best free place to learn it properly.
Match the goal
04How to pick a data type for a goal
Read the goal’s own words, its behavior, conditions and criterion; they usually name the data type. If it is unclear how a goal will be measured, ask the IEP team to clarify it before you settle on a sheet.
| If the goal says… | Collect |
|---|---|
| “…times per day” or “…per class period” | Frequency, in the same period each day |
| “…for 10 minutes” | Duration |
| “…within 30 seconds of a direction” | Latency |
| “…with 9 of 10 correct” or “…accuracy” | Trial-by-trial, as a percentage correct |
| “…complete the steps of…” a routine | Task analysis, as steps done on their own |
| “…will write…” or “…will complete…” work | Permanent product |
| “…engaged during…”, or a behavior too frequent to count | Interval or momentary time sampling |
| The team is asking why a behavior happens | ABC notes, then talk them through with the team |
Two more checks before you start. First, collect a baseline: for behavior goals, IRIS notes that capturing a student’s typical behavior “usually requires collecting data for a minimum of one to two weeks” (IRIS). Second, pick a method that works in your room: IRIS calls it important “to select a progress monitoring method that is appropriate for the behavior and feasible in the classroom.” Our free IEP goal bank has 35 example goals across six domains, each with its measurement and baseline context, to adapt with your team.
Keeping it doable
05Data for a group when you are one adult
One adult with six students can’t record everything, and doesn’t need to. What makes data useful is that it is taken the same way each time: IRIS notes that “data collection should occur during consistent time periods to allow for comparison over time” (IRIS).
- Tie it to a routine already on the schedule. Hand washing is measured before lunch; starting work is measured at the 9:00 direction. Same time, same place.
- Take a sample, not the whole day. A 10-minute window, or a short block of opportunities, at the same time each day is easier to keep than all-day recording.
- Rotate who records, not how often. Record for only as many students as you can watch accurately at once, and share the observations among the adults so every goal keeps the schedule its plan sets; for behavior goals, IRIS describes monitoring “typically occurring at least once per day.”
- Let the work keep the record. Permanent products (a worksheet, a writing sample) can be scored after the students leave.
- Keep the sheet where the work happens. A clipboard at the table, a tally counter or a sticky label on your sleeve; copy it onto the main sheet the same day.
- Share the work, and check it. A paraprofessional can record with the teacher’s written definition on the sheet. Every week or two, both adults record the same 10 minutes and compare; if they disagree, sharpen the definition.
Federal rules let schools use paraprofessionals and assistants “who are appropriately trained and supervised, in accordance with State law, regulation, or written policy” to assist in providing special education (34 CFR 300.156(b)(2)(iii)), so data collection by a trained paraprofessional, with the teacher reviewing it, is a common and sensible division of work.
Graph and decide
06Graph it, then use a decision rule
Numbers on a sheet are hard to read; a line on a graph isn’t. IRIS: “progress monitoring data are easiest to interpret when graphed” (IRIS). Put school days or sessions along the bottom and the measure up the side, plot each day’s value, and draw a goal line from the baseline to the level in the annual goal. Draw a vertical line wherever teaching changes.
The IRIS four-point rule for reading progress
The IRIS Center’s progress monitoring module gives this rule for reading scores, where a higher score means progress (IRIS, Progress Monitoring: Reading, page 7). For a measure where a lower number means progress, such as shorter latency, agree with your team how the graph will be read before you start.
- Collect enough first: “the educator should graph at least six to eight data points,” and IRIS notes that “Implementing at least three weeks of instruction allows an educator to decide whether the instruction is effective.”
- Four most recent points above the goal line: “a slightly more ambitious goal is needed.”
- Four most recent points below the goal line: “the student is not making adequate progress,” and “the educator should try a different instructional approach and continue to collect data.”
- Neither four above nor four below: “the educator should keep collecting data until it is possible to apply a decision-making rule.” IRIS adds: “No changes to instruction are necessary at this time.”
- Eight points and still no pattern of four: “the educator should use a trend line analysis.” If the trend line is steeper than the goal line, “a more ambitious goal is needed”; if it is flatter, “the student is not making adequate progress” and “the educator should implement a different instructional approach”; if it is around the goal line, “the student is on target to meet the goal” and “the educator should continue collecting data.”
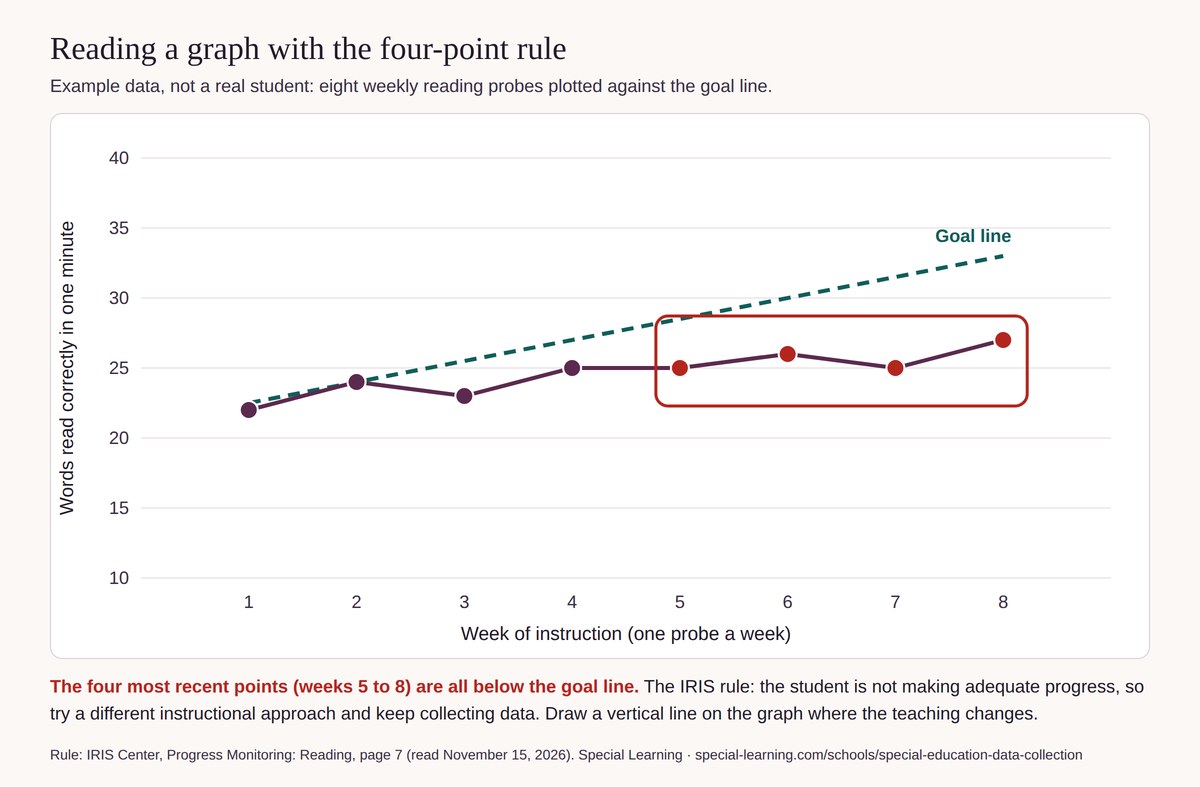
Beyond reading, NCII’s data-based individualization process uses the same idea for academic and behavior goals: graphed data are “evaluated against the student’s instructional or behavioral goal to determine whether the student is making sufficient progress,” and “If the student’s progress is insufficient, the teacher consults with a team to determine how to further intensify the intervention” (NCII, Progress Monitoring). IRIS and NCII built a free three-hour module on this whole cycle: Intensive Intervention (Part 2): Collecting and Analyzing Data for Data-Based Individualization.

Privacy
07Keep student data private
Data sheets are about a student, so treat them as part of the student’s record. FERPA is the federal law that gives parents “the right to have access to their children’s education records, the right to seek to have the records amended, and the right to have some control over the disclosure of personally identifiable information from the education records”; those rights pass to the student at 18 or on entering a postsecondary institution (U.S. Department of Education, What is FERPA?). In practice:
- Keep sheets secure. A student code on clipboards and tally sheets cuts exposure, but codes, initials and details can still identify a student, so keep sheets where only authorized staff see them, and store any code key separately and securely.
- Only non-identifying practice text in free online tools on a shared or personal device: no names or other identifying information. Our ABC tool asks for the same. Real student records go in the district-approved system.
- Store and share the way your district says. Move the day’s numbers into the district’s system, and shred paper sheets when your district’s rules allow.
Free tools
08Free data sheets and tools
Free first, from the public programs:
- NCII’s Student Progress Monitoring Tool for Data Collection and Graphing, an Excel workbook for academic progress monitoring that “allows educators to store data for multiple students (across multiple measures), graph student progress, and set individualized goals for a student on specific measures.”
- AFIRM’s Task Analysis module and brief packet, with checklists and a monitoring progress checklist. AFIRM says “All content is now freely available” (AFIRM).
- The IRIS Center’s module on behavioral intervention plans, whose page on progress monitoring explains each observation method.
And ours, free on special-learning.com:
| Tool | What it does |
|---|---|
| ABC data collection tool | Records the time, what happened right before, what the student did and what happened right after, with quick-pick choices and room for your own words; saves entries in your browser and exports a CSV to discuss with your team. |
| Data graphing tool | Plots your sessions as frequency, rate, duration, percentage, latency or percentage of intervals, with phase lines and condition labels, shows a data table of every value, and downloads the graph as a PNG. Blank entries stay as gaps and zeros plot as zeros. Points plot in the order you enter them, and it draws no trend line, so you add the goal line and decide yourself. |
| Session note generator | Builds a structured note in SOAP format (subjective, objective, assessment, plan) with each goal’s data type (from frequency to trial-by-trial and latency), the day’s data and the procedures used, such as task analysis and chaining; you copy or print it. |
| IEP goal bank | 35 example goals across six domains, from communication to daily living, each with its measurement and baseline context, to adapt with your IEP team. |
| Reinforcement preference checklist | Records a student’s reported preferences across eight categories and prints a list to discuss with the student and their support team. |
Want to practice this with your team? The free December 8 session includes this page’s subject: “See whether it worked. Two numbers to write down for a few days, and how to graph them with our free ABA Behavior Data Graphing Tool.” Then live questions with Jeff.
From the course records, November 15, 2026
09Training for the teaching the data measures
Data tells you whether teaching is working; the teaching itself is the other half. Each of these has a free 7-day trial.
Intro to ABA: Level 1
Intro to ABA: Level 1 is a course on the methods and techniques of ABA, built for the people who work with the child every day: parents and caregivers, teachers, paraprofessionals and behavior technicians. Its nine online sessions, drawn largely from work with young children in classrooms and homes, cover what autism is, an overview of ABA, methods of teaching, errorless teaching and prompting, active student responding, beginner classroom participation skills, and an introductory session on functional behavior assessment. Prompting is the help you record on a task analysis sheet, and functional behavior assessment is where ABC data is put to use; both are among the 28 evidence-based practices in NCAEP’s 2020 report. A final exam follows the sessions, and the course comes with downloadable materials.
- One person: $199, paid once, with 11 weeks to complete the course (the course page).
- A school training 10 or more: $99 a person, paid once. Each person has 12 weeks from the day they activate their own access, so staff who start later still get their full 12 weeks (the group course page).
- The 7-day free trial: the individual Level 1 trial offers the first two sessions, “What is Autism” and “ABA Overview”, for 7 days. Each person needs their own account; no payment card is requested for the trial (start the individual free trial).
Completing this course earns a Special Learning certificate of completion.
Task Analysis Data Sheet Library
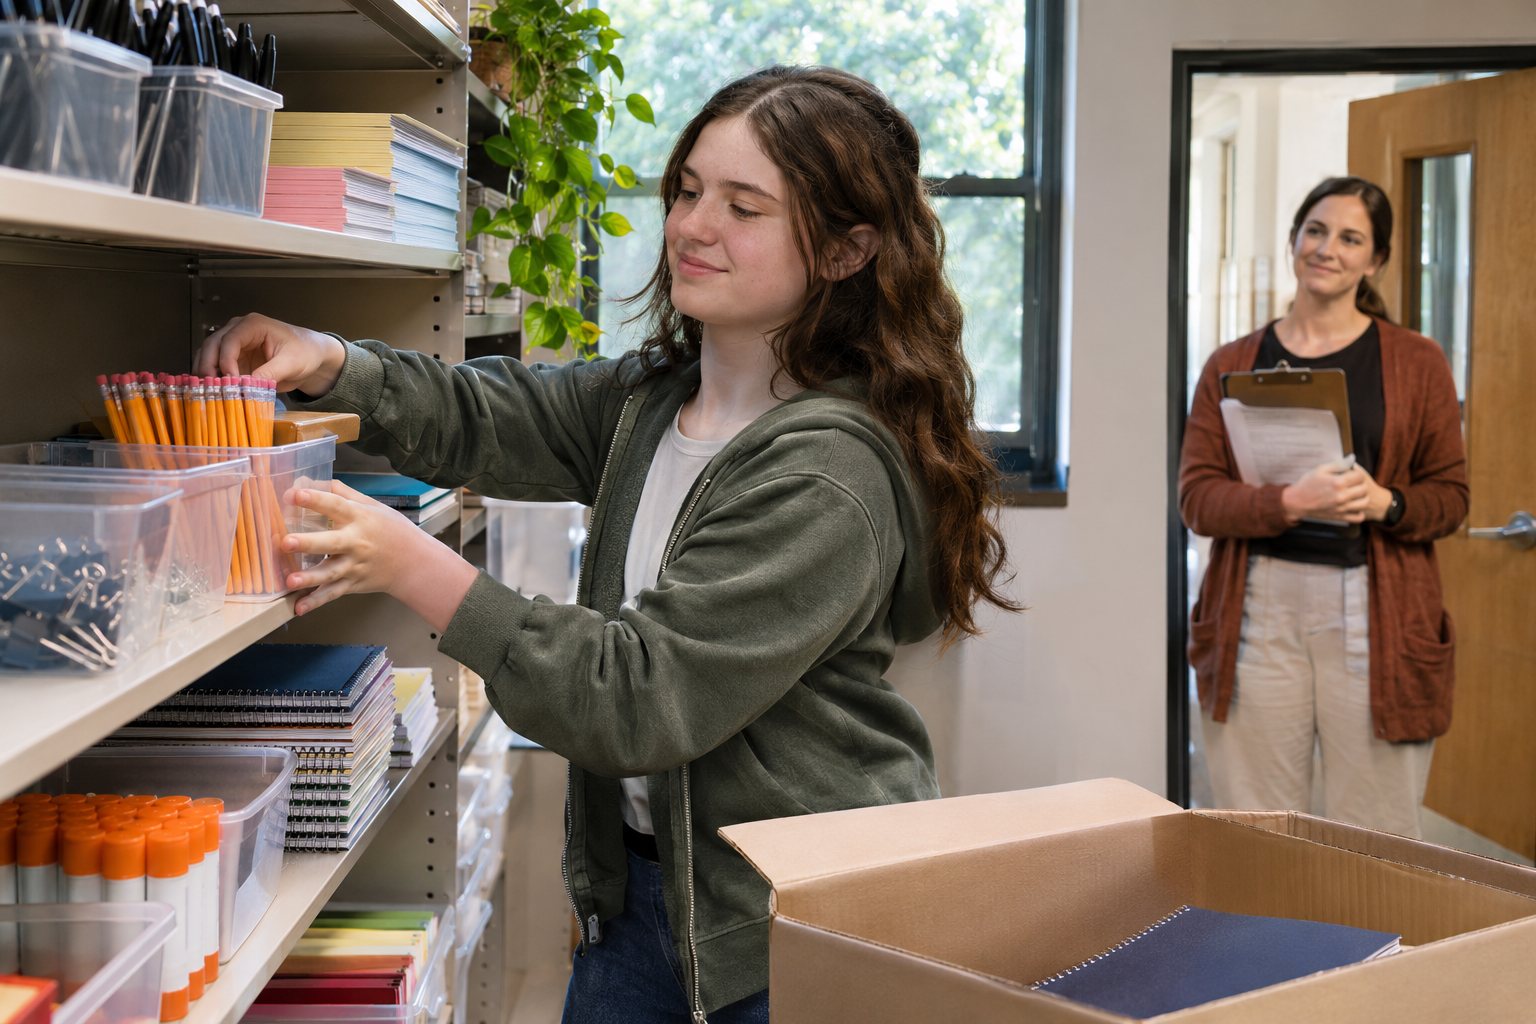
Ready-made task analysis data sheets that break skills into their steps, in two sets, daily living skills and job skills, with an instruction guide and step-by-step videos of skills from washing hands and making a sandwich to restocking supplies and clocking out for work. Task analysis is one of the evidence-based practices AFIRM teaches for free (AFIRM); the library gives you the sheets ready-made. It is built for learners from age 5 into young adulthood. $129 for 12 months of access, one payment, with a 7-day free trial (the library page, or start the free trial).
Training 10 or more staff? Ask for a written quote or plan your team and see the cost.
Questions
10Questions teachers and paraprofessionals ask
What is task analysis in special education?
Task analysis breaks a skill or routine, such as hand washing or packing up, into small steps, taught by forward chaining, backward chaining or total task presentation, with each step recorded every time. AFIRM says it “can be used to break down complex skills or behaviors into smaller, discrete steps,” and as the learner masters each step, “the learner will gradually become more independent” (AFIRM). Staff record each step as done on their own or with the help that was needed, and graph the share of steps done on their own.
What are the main data collection methods in special education?
Frequency or event recording, duration, latency, interval recording and time sampling, ABC notes, trial-by-trial data with percentage correct, task analysis, permanent product and rating scales such as Direct Behavior Rating. IRIS describes the observation methods on its progress monitoring page.
What is the difference between forward and backward chaining?
In forward chaining, “The first step in a chain is taught first.” In backward chaining, “The final step in a chain is taught first,” and as each step is mastered the one before it is taught. In total task presentation the learner does the whole chain each time (AFIRM).
How often should teachers collect data on IEP goals?
Often enough to decide well before the next progress report. Your IEP says how progress will be measured and when it is reported (34 CFR 300.320(a)(3)). For behavior goals, IRIS describes regular progress monitoring “typically occurring at least once per day” after a baseline of one to two weeks (IRIS), and its decision rule needs at least six to eight graphed points (IRIS).
Can paraprofessionals collect IEP data?
Yes, commonly. Federal rules let paraprofessionals who are “appropriately trained and supervised, in accordance with State law, regulation, or written policy” assist in providing special education (34 CFR 300.156(b)(2)(iii)). The teacher writes the definition on the sheet, shows how to record, checks agreement by recording the same 10 minutes now and then, and reviews the graph.
How do you decide whether a student is making progress?
Graph the data with a goal line. The IRIS four-point rule: after six to eight points, if the four most recent are above the goal line, raise the goal; if they are below it, change the teaching and keep collecting; if neither, keep the teaching unchanged and keep collecting. After eight points with no run of four above or below, draw a trend line: steeper than the goal line, raise the goal; flatter, change the teaching; around it, keep teaching and collecting. IRIS writes this rule for reading scores, where higher means progress, and applies it this after at least three weeks of instruction (IRIS).
Should student names go on data sheets?
Follow your district’s procedures for identifying students on authorized records, and keep sheets secure; codes and initials don’t make a sheet anonymous. Use only non-identifying practice text in free tools on shared or personal devices. FERPA gives parents rights over their children’s education records, including “some control over the disclosure of personally identifiable information,” and those rights pass to the student at 18 or on entering a postsecondary institution (U.S. Department of Education).
Is there a free data collection sheet or graphing tool?
Yes. NCII offers a free Excel tool for data collection and graphing, AFIRM’s Task Analysis packet includes a monitoring progress checklist, and our free ABC data tool and data graphing tool run in your browser.
Your next step
Pick one goal this week, write its definition on a sheet, and collect a baseline. For the teaching that the data measures, watch the first two sessions of Level 1 free for 7 days. Starting the trial asks for no payment card.
Try the first two sessions freeMore for school teams: training for schools, special education training online, autism training for paraprofessionals and ABA for educators.